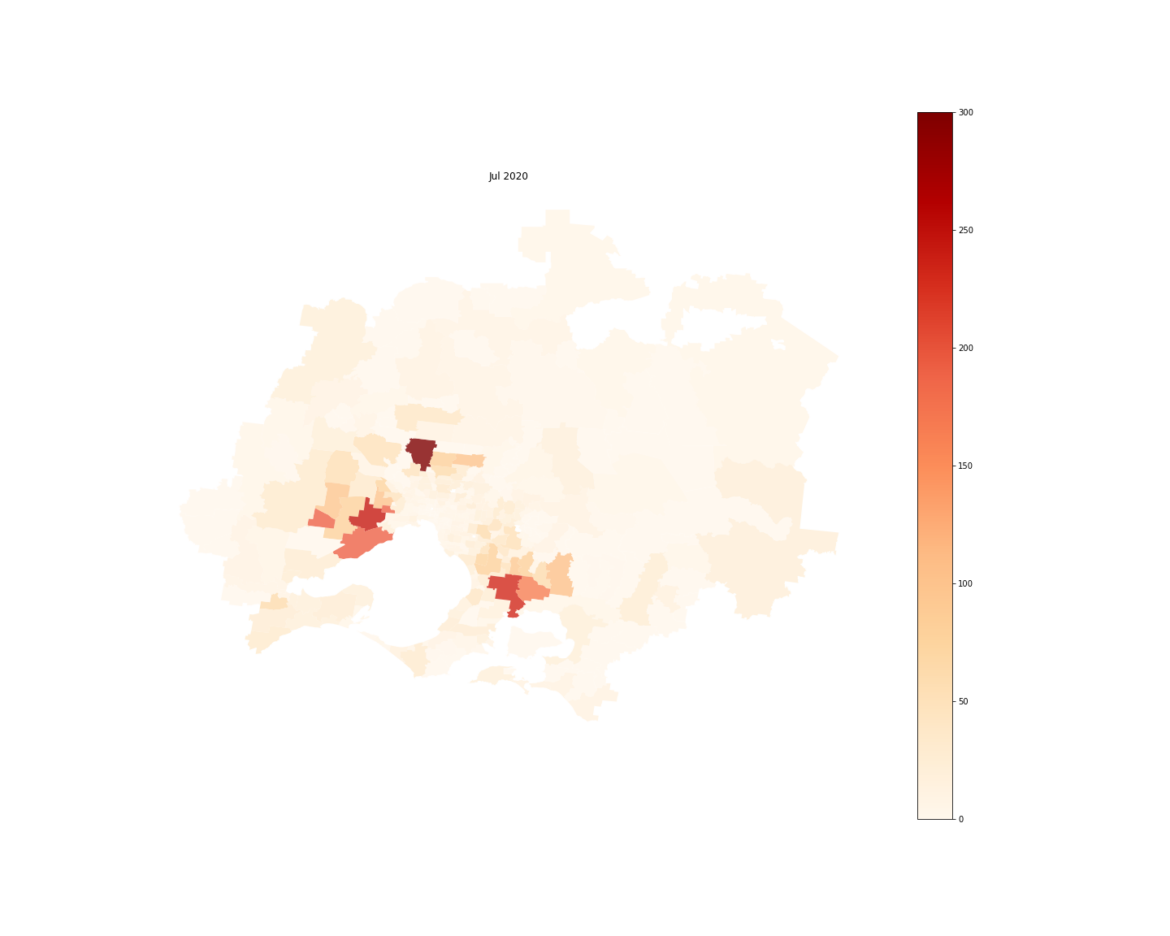
In July 2020, Melbourne entered its second COVID-19 lockdown – a lockdown which would not be lifted until late October. I thought it would be rather interesting to visualise the impact of this event on the number of PV system installations in each postcode of the city. These figures are based on the data provided by the Clean Energy Regulator which I merged with the spatial postcode data provided by the Australian Bureau of Statistics.
Pre-lockdown
Here’s how things looked in the months leading up to the lockdown – you can see how a few postcodes (in particular 3064 which appears to encompass Roxburgh Park) were having so many PV systems installed, I actually had to cap the maximum value of my heatmap at 300 so you could compare it to other postcodes in the figure.


Lockdown
The heatmap practically disappears.


Post-lockdown
Once the lockdown was lifted in late October, the install numbers really came roaring back!


Thoughts
While it’s fascinating seeing the impact that the lockdown had on the number of PV system installations, the thing I find even more amazing is just how many systems are going in each month, and how it appears to be concentrated in just a few suburbs in the city. The postcode 3064 alone, had 2,484 systems installed in 2020! November alone saw 400 installed in this postcode (while in September at the height of the lockdown there were just 8 installations).
