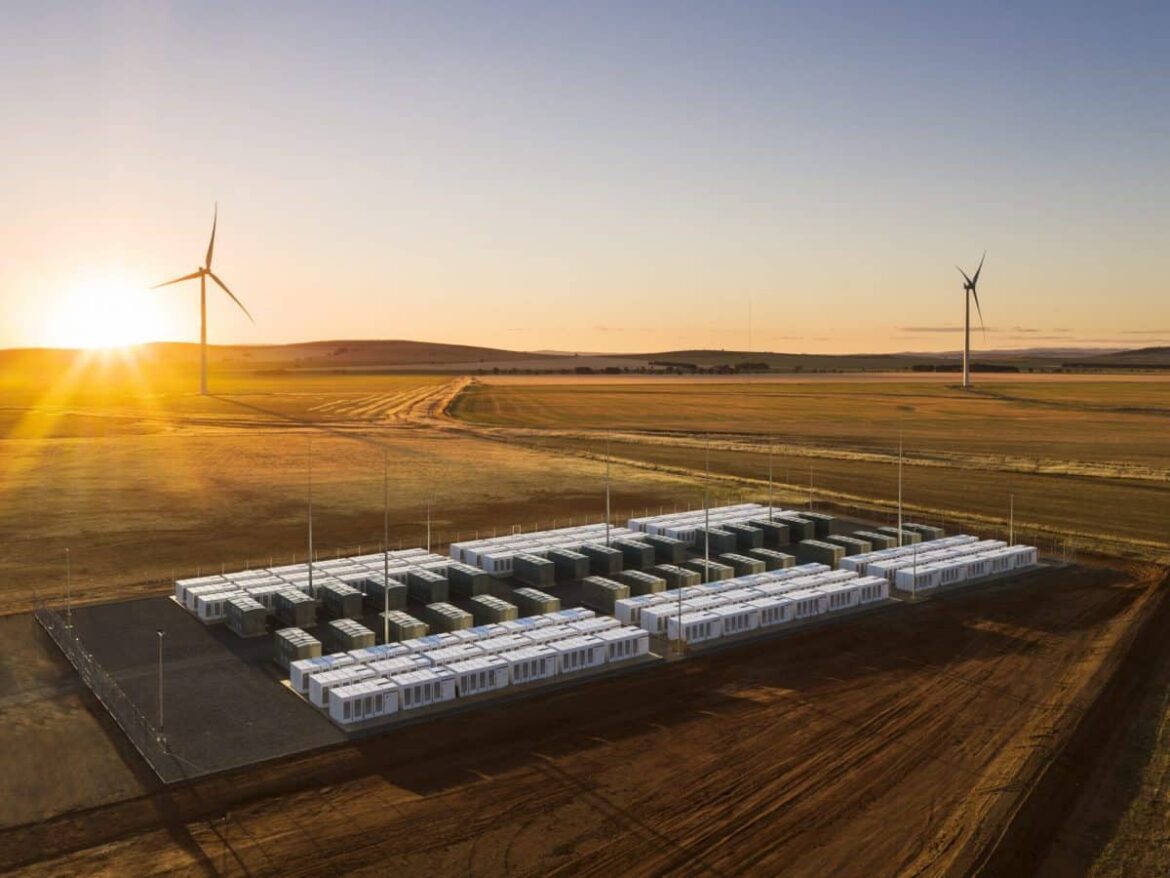
Lately I’ve been working with AEMO’s 4-second interval data from the National Electricity Market (NEM). Visualising the grid at this resolution is so fascinating, and I wanted to share a couple of figures I’d generated looking at the Hornsdale Power Reserve (the big Tesla battery). The figures have also raised a couple of questions for me which I’ve recorded below.
In all the figures, the battery has no dispatch target – rather it is responding to the automatic generation control (AGC) regulation instructions. In the figures:
- Left y axis:
- MW is what the battery was doing
- Positive values mean the battery is discharging
- Negative values mean the battery is recharging
- Target Ramp is the dispatch target of the generator
- Target Ramp + Reg adds in the regulation component to the target
- MW is what the battery was doing
- Right y axis:
- Hz is the mainland system frequency


Question: The battery does not appear to be as close to its targets as I thought it would – is this real or is the 4-second resolution too slow to see the true generation of the battery?

Question: Could this be the battery responding to a contingency event as it is not generating in response to dispatch or regulation targets? That said, the system frequency doesn’t appear to deviate too much from 50 Hz.
I hope you found some of these figures as fascinating as I did – it’s amazing seeing how much the battery is doing in each dispatch interval! If you think you might know the answer to some of my questions, please let me know!
